


Welcome

Welcome to Prairie Crop Charts


Site design & maintenance by Branscombe Consulting
Copyright 2024 Canadagrain
Disclaimer: Information is secured from sources believed to be reliable, but 100% accuracy cannot be guaranteed. For charting purposes, some price data for illiquid markets may be
interpolated.
Persons associated with Canadagrain.com deal commercially with businesses active in Prairie grain markets and may hold positions on their own accounts in commodities discussed
herein.
Prairie Crop Charts does not provide specific marketing advice or advice on trading opinions on futures and option contracts.
Any charts, opinions, chats, messages, news, research,
analyses, prices, or other information contained on this website are provided as general market information for educational and entertainment purposes only and do not constitute
investment advice. Canadagrain.com will not accept liability for any loss or damage, including without limitation any loss of profit, which may arise directly or indirectly from use of or
reliance on such information.
Canadagrain.com, 905 – 167 Lombard Ave., Winnipeg, MB R3B 0V3, tel: (204) 942-1459 fax: (204) 942-7652
Crops covered by Prairie Crop Charts include:
grains CWRS CPSR Durum Feed General Feed Barley Malt
Barley Feed Grains Corn Feed Wheat Oats
Oilseeds Canola Flax Mustard Brown Oriental Yellow
Soybeans Sunflower Pulses Lentils Eston Laird Red Peas
Green Yellow Dry Beans Other Crops Canary Seed
Chickpeas Rye Special Studies
Barley Corn Oats CWRS CPSR Durum Feed General Canola
Flax Mustard Sunflower Soybeans Lentils Peas Dry Beans
Canary Seed Chickpeas Rye
Charts - a pictorial history of markets - can be a powerful decision making tool. Patterns
repeat.
In any market, knowing what is likely to happen is a big edge. Most commodity spec funds,
for example, trade on charts. If charts work for billion dollar hedge funds, odds are they may
provide you a hand when you’re marketing your 10,000 bushels of lentils. For a farmer, charts
can be a helpful marketing tool.
A Prairie Crop Charts subscription gives you access to over 300 charts that cover the grains,
oilseeds and special crops grown on the Prairies: canola, oats, wheat, barley, flax, soybeans,
red and green lentils, brown, yellow and oriental mustard, canary, green and yellow peas,
chickpeas, edible beans and more.
Updates occur by 8:00 am central time each weekday that Canadian markets are open.
Select crop and futures charts are updated each weekday to keep you up-to-date on the major
grain and oilseed markets. All charts are updated once a week on a rotating schedule (e.g,
wheat charts are updated on Mondays, canola and flax charts on Tuesdays, etc.)
Don’t miss out on this unique and valuable resource. Subscribe today! A one year subscription costs
only $200. A monthly option at $20 (recurring charge) is also available. Complete and submit the
subscription order form or call 1-800-567-5671 or 1-204-942-1459.
Average Crop Prices
For July 11, 2025
($CDN/bu Delivered Elevator)
SK
MB
AB
Canola
14.48
14.71
14.81
#1 CWRS
7.65
7.82
7.91
#2 CPSR
6.77
-
7.06
Durum
9.04
-
9.27
Feed Barley
5.23
5.18
5.83
Oats
-
4.42
4.48
Yellow Peas
9.28
9.28
9.03
This is a just a small sample of the
crop prices we survey.
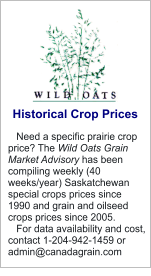
Looking for current or historical crop
price data? We offer daily and weekly
update services and maintain
datasets covering 30 years of weekly
and 15 years of daily crop prices for
the grains, oilseeds and special crops
grown in Saskatchewan, Manitoba
and Alberta. For data availability and
cost, contact Canadagrain.com at
204-942-1459.


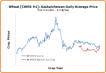
Charts include:
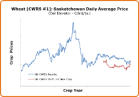
CWRS (SK, MB, AB)
CPSR (SK, MB, AB)
Durum (SK, AB, ND, MT)
Feed (SK, MB, AB)
DNS (ND) & HRW (MT)
Provincial & International Comparisons
5 and 10 Year CWRS Seasonals (SK, MB, AB)


Updates Mondays
Last Updated: July 14, 2025
Updates Tuesdays
Last Updated: July 15, 2025
Updates Wednesdays
Last Updated: July 16, 2025
Updates Thursdays
Last Updated: July 17, 2025
Subscribers: Chart updates for July 18, 2025.
We welcome your feedback: Your feedback regarding the crops covered, charts that you
would like to see, presentation, etc. is greatly appreciated. Feel free to contact us at 1-800-
567-5671 or email admin@canadagrain.com.
Quick links to the charts:
Barley Canaryseed Canola Chickpeas Corn Dry Beans Flax Lentils Mustard Oats Peas Rye Soybeans Sunflower Wheat
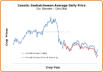
Charts include:
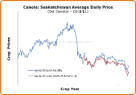
Western Canada (SK, MB, AB)
5, 10, 15 and 20 Year Seasonals (SK, MB, AB)
Nexera (SK)
ICE Canola Futures
North Dakota & Minnesota Canola
Provincial & International Comparisons
Charts include:
CWRS (SK) & Canola (SK)
DNS (ND) & Soybeans (ND)
ICE Futures Canola
CME Corn, Soybeans, Soyoil, Soymeal, Wheat, Oats
MGEX Wheat, KCBT Wheat
BURSA Palm Oil
India Barley, Maize
Brazil Soybeans, Corn
Charts include:
Feed Western Canada (SK, MB, AB)
Feed - 5, 10 and 15 Year Seasonals (SK, MB, AB)
Feed (North Dakota & Montana)
Feed - Provincial & International Comparisons
Malt Western Canada (SK, AB)
Malt (North Dakota & Montana)
Malt - Provincial & International Comparisons
Charts include:
Western Canada (SK, MB, AB)
5, 10 and 15 Year Seasonals (SK, MB, AB)
North Dakota
CME Oats Futures
Prairie & International Comparisons

Updates Wednesdays
Last Updated: July 16, 2025
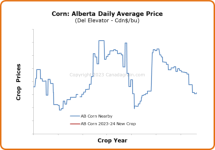
Charts include:
Canada (MB, AB, ON)
North Dakota
CME Corn Futures
Prairie & International Comparisons
Seasonals (Available Soon)


Updates Tuesdays
Last Updated: July 15, 2025
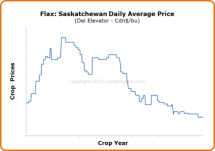
Charts include:
Western Canada (SK, MB, AB)
North Dakota
Prairie & International Comparisons
Seasonals (Available Soon)


Updates Thursdays
Last Updated: July 17, 2025
Charts include:
Canada (MB, ON)
North Dakota
CME Soybean Futures
Prairie & International Comparisons
Seasonals (Available Soon)


Updates Fridays
Last Updated: July 18, 2025
Charts include:
Western Canada
North Dakota (Bird Seed)
Prairie & International Comparisons
Seasonals (Available Soon)


Charts include:
North Dakota (Nusun)
Seasonals (Available Soon)


Updates Thursdays
Last Updated: July 17, 2025
Charts include:
Yellow - Western Canada, North Dakota
Green - Western Canada, North Dakota, Washington
Maple - Western Canada
Feed - Western Canada (SK, AB)
Prairie Price Comparisons
Seasonals (Available Soon)


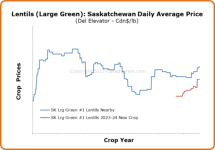
Charts include:
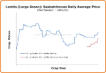
Green (Small, Medium and Large) - Western Canada
Red - Western Canada
North Dakota (Medium Green)
Price Comparisons
Seasonals (Available Soon)


Charts include:
Kabuli - Western Canada
Desi & B-90 - Western Canada
Price Comparison
Seasonals (Available Soon)


Charts include:
Yellow - Western Canada
Brown - Western Canada
Oriental - Western Canada
Price Comparisons
Seasonals (Available Soon)


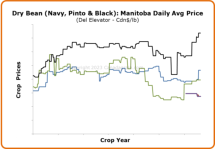
Charts include:
Navy & Pinto - Prairies (MB, ND)
Black - Prairies (MB)
Dark & Light Red Kidney - Prairies (MB)
Great Northern & Small Red - Prairies (MB)
Pink & Cranberry - Prairies (MB)
Prairie Price Comparisons (MB, ND, MI, WA)
Seasonals (Available Soon)


Charts include:
Western Canada


Updates Fridays
Last Updated: July 18, 2025
Updates Fridays
Last Updated: July 18, 2025
Updates Fridays
Last Updated: July 18, 2025
Updates Fridays
Last Updated: July 18, 2025
Updates Fridays
Last Updated: July 18, 2025
Updates Fridays
Last Updated: July 18, 2025
Updates each weekday morning
Last Updated: July 18, 2025


Welcome
Welcome to Prairie Crop Charts

Site design & maintenance by Branscombe Consulting
Disclaimer: Information is secured from sources believed to be reliable, but 100% accuracy cannot
be guaranteed. For charting purposes, some price data for illiquid markets may be interpolated.
Persons associated with Canadagrain.com deal commercially with businesses active in Prairie grain
markets and may hold positions on their own accounts in commodities discussed herein.
Prairie Crop Charts does not provide specific marketing advice or advice on trading opinions on
futures and option contracts.
Any charts, opinions, chats, messages, news, research, analyses, prices,
or other information contained on this website are provided as general market information for
educational and entertainment purposes only and do not constitute investment advice.
Canadagrain.com will not accept liability for any loss or damage, including without limitation any loss
of profit, which may arise directly or indirectly from use of or reliance on such information.
Canadagrain.com, 905 – 167 Lombard Ave., Winnipeg, MB R3B 0V3,
tel: (204) 942-1459 fax: (204) 942-7652
Charts - a pictorial history of markets - can be a powerful
decision making tool. Patterns repeat.
In any market, knowing what is likely to happen is a big
edge. Most commodity spec funds, for example, trade on
charts. If charts work for billion dollar hedge funds, odds are
they may provide you a hand when you’re marketing your
10,000 bushels of lentils. For a farmer, charts can be a
helpful marketing tool.
A Prairie Crop Charts subscription gives you access to over
300 charts that cover the grains, oilseeds and special crops
grown on the Prairies: canola, oats, wheat, barley, flax,
soybeans, red and green lentils, brown, yellow and oriental
mustard, canary, green and yellow peas, chickpeas, edible
beans and more.
Updates occur by 8:00 am central time each weekday that
Canadian markets are open. Select crop and futures charts
are updated each weekday to keep you up-to-date on the
major grain and oilseed markets. All charts are updated once
a week on a rotating schedule (e.g, wheat charts are updated
on Mondays, canola and flax charts on Tuesdays, etc.)
Don’t miss out on this unique and valuable resource. Subscribe
today! A one year subscription costs only $200. A monthly option at
$20 (recurring charge) is also available. Complete and submit the
subscription order form or call 1-800-567-5671 or 1-204-942-
1459.


Subscribers: Chart updates for July 18, 2025


Welcome to Prairie Crop Charts

Site design & maintenance by Branscombe Consulting
Disclaimer: Information is secured from sources believed to be reliable, but
100% accuracy cannot be guaranteed. For charting purposes, some price data
for illiquid markets may be interpolated.
Persons associated with Canadagrain.com deal commercially with businesses
active in Prairie grain markets and may hold positions on their own accounts in
commodities discussed herein.
Prairie Crop Charts does not provide specific marketing advice or advice on
trading opinions on futures and option contracts.
Any charts, opinions, chats,
messages, news, research, analyses, prices, or other information contained on
this website are provided as general market information for educational and
entertainment purposes only and do not constitute investment advice.
Canadagrain.com will not accept liability for any loss or damage, including
without limitation any loss of profit, which may arise directly or indirectly from
use of or reliance on such information.
Canadagrain.com, 905 – 167 Lombard Ave., Winnipeg, MB
R3B 0V3, tel: (204) 942-1459 fax: (204) 942-7652
Charts - a pictorial history of markets - can
be a powerful decision making tool. Patterns
repeat.
In any market, knowing what is likely to
happen is a big edge. Most commodity spec
funds, for example, trade on charts. If charts
work for billion dollar hedge funds, odds are
they may provide you a hand when you’re
marketing your 10,000 bushels of lentils. For a
farmer, charts can be a helpful marketing tool.
A Prairie Crop Charts subscription gives you
access to over 300 charts that cover the
grains, oilseeds and special crops grown on the
Prairies: canola, oats, wheat, barley, flax,
soybeans, red and green lentils, brown, yellow
and oriental mustard, canary, green and yellow
peas, chickpeas, edible beans and more.
Updates occur by 8:00 am central time each
weekday that Canadian markets are open.
Select crop and futures charts are updated
each weekday to keep you up-to-date on the
major grain and oilseed markets. All charts are
updated once a week on a rotating schedule
(e.g, wheat charts are updated on Mondays,
canola and flax charts on Tuesdays, etc.)
Don’t miss out on this unique and valuable
resource. Subscribe today! A one year subscription
costs only $200. A monthly option at $20 (recurring
charge) is also available. Complete and submit the
subscription order form or call 1-800-567-5671
or 1-204-942-1459.


Subscribers: Chart updates for July 18, 2025
Welcome